Charts have become indispensable tools for visualizing data in information dissemination, business decision-making, and academic research. As the volume of multimodal data grows, a critical need arises for automated chart comprehension, which has garnered increasing attention from the research community. Recent advancements in Multimodal Large Language Models (MLLMs) have demonstrated impressive capabilities in comprehending images and executing instructions effectively. However, existing chart understanding models confront several challenges, including extensive parameter requirements, susceptibility to errors in numerical calculations, and inefficiencies in encoding high-resolution images.
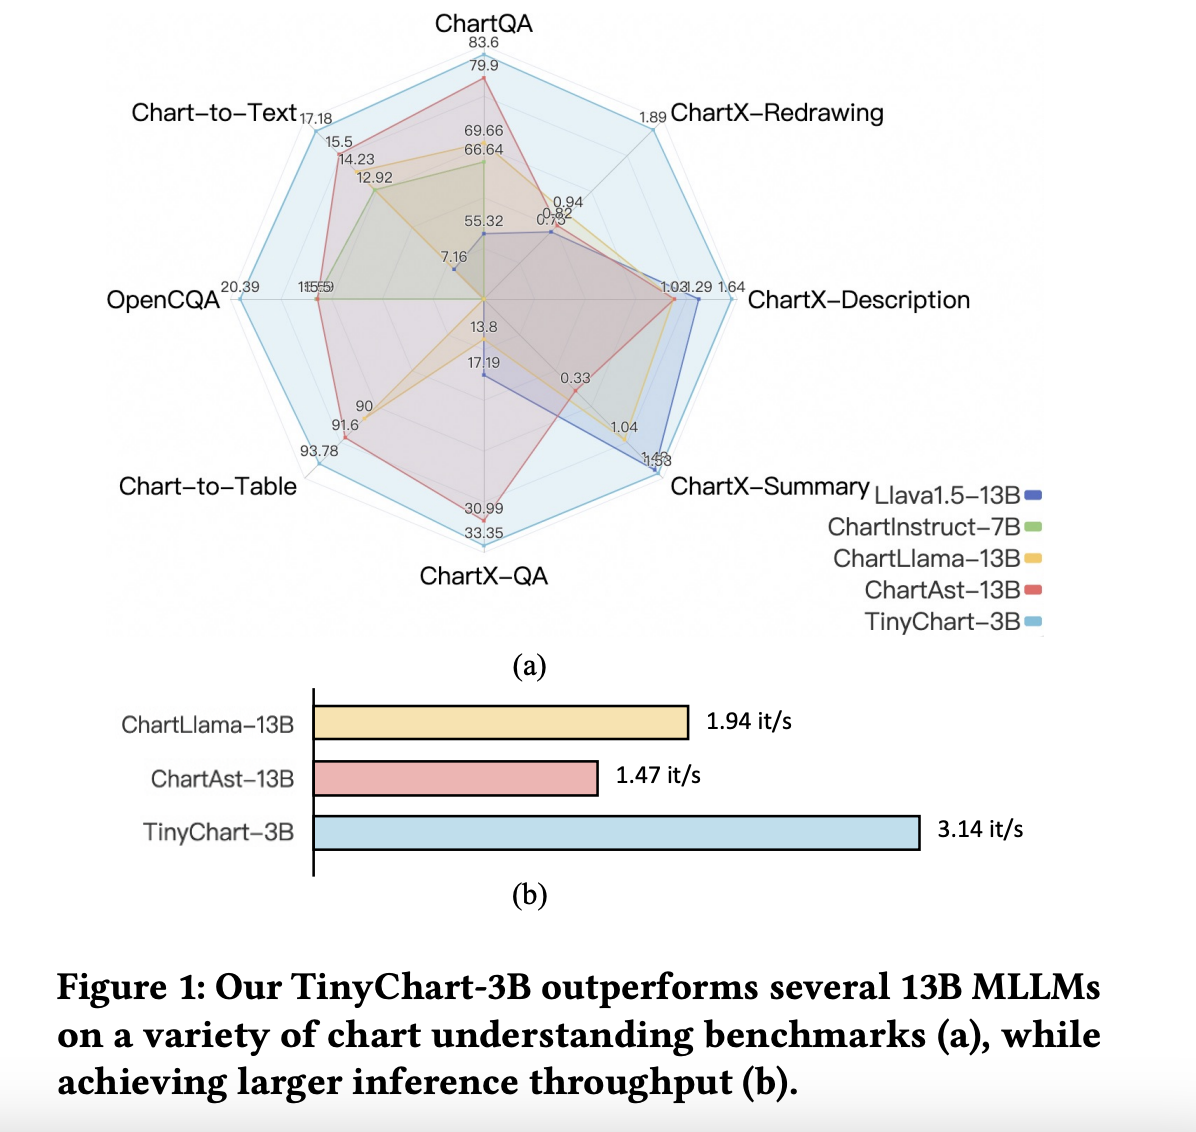
To address these limitations, a team of researchers from China has proposed an innovative solution: TinyChart. Despite its modest 3 billion parameters, TinyChart exhibits state-of-the-art performance across various chart comprehension benchmarks while boasting faster inference speeds. The model achieves this efficiency by combining techniques, including efficient visual encoding and Program-of-Thoughts learning strategies. Inspired by prior work, Visual Token Merging optimizes visual feature sequences by aggregating similar tokens, thus enabling efficient encoding of high-resolution chart images without overwhelming computational demands.
Furthermore, TinyChart’s Program-of-Thoughts (PoT) learning strategy significantly enhances the model’s ability to tackle numerical calculations, a task that often stumps existing chart understanding models. By training the model to generate Python programs step by step for computation problems, TinyChart can produce accurate answers with improved efficiency. The researchers have meticulously curated the ChartQA-PoT dataset to support this learning approach, leveraging template-based and GPT-based methods for constructing question-answer pairs.
The introduction of TinyChart marked a significant advancement in understanding multimodal charts. It outperforms larger MLLMs in terms of performance and also excels in speed, making it a practical solution for real-world applications where computational resources are constrained. By integrating Visual Token Merging and Program-of-Thoughts learning, TinyChart demonstrates how innovative strategies can overcome the challenges faced by current chart understanding models, paving the way for more efficient and accurate data analysis and decision-making processes.
In addition to its technical innovations, TinyChart’s contributions extend to its impact on chart comprehension. By introducing a novel approach to learning numerical calculations through a program of thought, the model enhances its own performance and sets a precedent for future research endeavors in this domain. The creation of the ChartQA-PoT dataset further enriches the resources available for training and evaluating chart understanding models, providing a valuable asset for researchers and practitioners alike.
Adopting Visual Token Merging within TinyChart represents a significant step forward in addressing the challenge of efficiently encoding high-resolution chart images. This technique not only streamlines computational processes but also preserves the integrity of visual data, ensuring that important details are not lost in the encoding process. As a result, TinyChart can handle complex chart structures with precision and accuracy, empowering users to extract meaningful insights from diverse datasets.
Check out the Paper. All credit for this research goes to the researchers of this project. Also, don’t forget to follow us on Twitter. Join our Telegram Channel, Discord Channel, and LinkedIn Group.
If you like our work, you will love our newsletter..
Don’t Forget to join our 40k+ ML SubReddit
Arshad is an intern at MarktechPost. He is currently pursuing his Int. MSc Physics from the Indian Institute of Technology Kharagpur. Understanding things to the fundamental level leads to new discoveries which lead to advancement in technology. He is passionate about understanding the nature fundamentally with the help of tools like mathematical models, ML models and AI.