How to Build a Data-Driven Customer Management System
CUSTOMER BASE MANAGEMENTA High-Level Framework for Building a CBM System with Strategic ImpactImage created by the author using CanvaImagine if your customer data could tell a story — one that drove key decisions, optimized pricing, and forecast future revenue with accuracy.As a data scientist, I have spent a large part of my career designing and building customer base management (CBM) systems. These are systems that monitor and predict anything from customer churn and customer price elasticity to recommending the products customers are most likely to buy.I have witnessed how CBM systems have been successfully adopted by organizations, and enabled them to execute their strategy through effective pricing, improved retention and more targeted sales activities. Combining forecasting with the visual effect of dashboards, CBM systems can provide an effective way for managers to communicate with executive leadership. This enhances decision-making and helps leaders better understand the consequences of their actions, particularly regarding the customer base and projected future revenues from that base.In this article we will explore both the foundational components of a CBM system, as well as the more advanced features that really ramp up the value generation. By the end of this guide, you’ll have a clear understanding of the key components of a CBM system and how advanced modules can enhance these foundations to give your company a competitive edge.The Foundation of a Strong CBM SystemImage created by the author using CanvaThe three main foundational components of a CBM systems are:ELT (extract-load-transform)Basic Churn ModellingDashboardsWith these three elements in place, managers are afforded a basic understanding of churn, a visual understanding of the data, and furthermore it allows them to communicate any findings to the leadership and other stakeholders. Below we detail each of these components in depth.ELT — Getting the DataExtract-Load-Transform, ELT for short, is the first and most critical part of a customer base management system. This is the component that feeds the system with data, and is often the first component to be built when creating a CBM system. To get started, you will typically interact with some kind of data platform where most of the rudimentary data manipulation has already been performed (in this case you are technically only required to do the “load” and “transform”), but sometimes you need get directly from source systems as well and “extract” the data.Irrespective of where the data comes from, it needs to be loaded into your system and transformed into a format that is easy to input into the machine learning models you are using. You will also likely need to transform the data into formats that makes it easier to make dashboards from the data. For some dashboards it might also be necessary to pre-aggregate a lot of data in smaller tables to improve query and plotting performance.It is easy to see that if there are mistakes in the ELT process, or if there are errors in the incoming data, this has the potential to severely affect the CBM system. Since everything in the system is based on this incoming data, extra care needs to be taken to ensure accuracy and alignment with business rules.I have seen multiple times where the ELT process has failed and led to mistakes in the churn predictions and dashboard. One way to monitor the consistency of the data coming into the system is to keep records of the distribution of each variable and track that distribution over time. In case of radical changes to the distribution you can then quickly check whether something is going wrong with the logic in the ELT process or if the problem is arising from data issues further upstream.Basic Churn ModellingThe second critical component in understanding your customer base is identifying who, when and why customers churn (for non-practitioners, “churn” refers to the point at which a customer stops using a product or service). A good churn prediction algorithm allows businesses to focus retention efforts where they matter most, and can help identify customers that are at an elevated risk of leaving.Back in the mid-1990s, telcos, banks, insurance companies and utilities where some of the first to start using churn modelling on their customer base, and developing basic churn models is relatively straightforward.The first task at hand is to decide the definition of churn. In many cases this is very straightforward, for example when a customer cancels a telco contract. However, in other industries, such as e-commerce, one needs to use some judgement when deciding on the definition of churn. For example, one could define a customer as having churned if that customer had not had a repeat shop 200 days after their last shop.After churn has been defined, we need to select and outcome period for the model, that is a time frame within which we want to observe churn. For example, if we want to create a churn model

CUSTOMER BASE MANAGEMENT
A High-Level Framework for Building a CBM System with Strategic Impact

Imagine if your customer data could tell a story — one that drove key decisions, optimized pricing, and forecast future revenue with accuracy.
As a data scientist, I have spent a large part of my career designing and building customer base management (CBM) systems. These are systems that monitor and predict anything from customer churn and customer price elasticity to recommending the products customers are most likely to buy.
I have witnessed how CBM systems have been successfully adopted by organizations, and enabled them to execute their strategy through effective pricing, improved retention and more targeted sales activities. Combining forecasting with the visual effect of dashboards, CBM systems can provide an effective way for managers to communicate with executive leadership. This enhances decision-making and helps leaders better understand the consequences of their actions, particularly regarding the customer base and projected future revenues from that base.
In this article we will explore both the foundational components of a CBM system, as well as the more advanced features that really ramp up the value generation. By the end of this guide, you’ll have a clear understanding of the key components of a CBM system and how advanced modules can enhance these foundations to give your company a competitive edge.
The Foundation of a Strong CBM System

The three main foundational components of a CBM systems are:
- ELT (extract-load-transform)
- Basic Churn Modelling
- Dashboards
With these three elements in place, managers are afforded a basic understanding of churn, a visual understanding of the data, and furthermore it allows them to communicate any findings to the leadership and other stakeholders. Below we detail each of these components in depth.
ELT — Getting the Data
Extract-Load-Transform, ELT for short, is the first and most critical part of a customer base management system. This is the component that feeds the system with data, and is often the first component to be built when creating a CBM system. To get started, you will typically interact with some kind of data platform where most of the rudimentary data manipulation has already been performed (in this case you are technically only required to do the “load” and “transform”), but sometimes you need get directly from source systems as well and “extract” the data.
Irrespective of where the data comes from, it needs to be loaded into your system and transformed into a format that is easy to input into the machine learning models you are using. You will also likely need to transform the data into formats that makes it easier to make dashboards from the data. For some dashboards it might also be necessary to pre-aggregate a lot of data in smaller tables to improve query and plotting performance.
It is easy to see that if there are mistakes in the ELT process, or if there are errors in the incoming data, this has the potential to severely affect the CBM system. Since everything in the system is based on this incoming data, extra care needs to be taken to ensure accuracy and alignment with business rules.
I have seen multiple times where the ELT process has failed and led to mistakes in the churn predictions and dashboard. One way to monitor the consistency of the data coming into the system is to keep records of the distribution of each variable and track that distribution over time. In case of radical changes to the distribution you can then quickly check whether something is going wrong with the logic in the ELT process or if the problem is arising from data issues further upstream.
Basic Churn Modelling
The second critical component in understanding your customer base is identifying who, when and why customers churn (for non-practitioners, “churn” refers to the point at which a customer stops using a product or service). A good churn prediction algorithm allows businesses to focus retention efforts where they matter most, and can help identify customers that are at an elevated risk of leaving.
Back in the mid-1990s, telcos, banks, insurance companies and utilities where some of the first to start using churn modelling on their customer base, and developing basic churn models is relatively straightforward.
The first task at hand is to decide the definition of churn. In many cases this is very straightforward, for example when a customer cancels a telco contract. However, in other industries, such as e-commerce, one needs to use some judgement when deciding on the definition of churn. For example, one could define a customer as having churned if that customer had not had a repeat shop 200 days after their last shop.
After churn has been defined, we need to select and outcome period for the model, that is a time frame within which we want to observe churn. For example, if we want to create a churn model with outcome period of 10 weeks, that would gives a a model that would predict the likelihood that a customer would churn at any point between the time of scoring and the next 10 weeks. Alternatively, we could have an outcome period of a year, which would give us a model that predicted churn at any time within the next year.
After the outcome period and churn definition has been decided, analysts need to transform the data into a format which makes it easy for the machine learning models to train on and also later for inference.
After the models are trained and predictions are being run on the active customer base, there are multiple different use cases. We can for example use the churn scores to identify customers at high risk of leaving and target them with specific retention campaigns or pricing promotions. We can also create differentiated marketing material to different groups of customers based on their churn score. Or we can use the churn score together with the products the customer has to develop customer lifetime value models, which in turn can be used to prioritize various customer activities. It is clear that proper churn models can give a company a strategic advantage in how it manages it customer base compared to competitors who neglect this basic component of CBM.
Dashboards
Dashboards, BI, and analytics used to be all the rage back in the 2000s and early 2010s, before the maturity of machine learning algorithms shifted our focus toward prediction over descriptive and often backwards looking data. However, for a CBM tool, dashboards remain a critical component. They allow managers to communicate effectively with leadership, especially when used alongside advanced features like price optimization. Visualizing the potential impact of a specific pricing strategy, can be very powerful for decision-making.
As with any data science project, you may invest thousands of hours in building a system, but often, the dashboard is the main point of interaction for managers and executives. If the dashboard isn’t intuitive or doesn’t perform well, it can overshadow the value of everything else you’ve built.
Additionally, dashboards offer a way to perform visual sanity checks on data and can sometimes reveal untapped opportunities. Especially in the early phases after a system has been implemented, and perhaps before all control routines have been set into production, maintaining a visual check on all variables and model performance can act as a good safety net.
With the main foundational pieces in place we can explore the more advanced features that have the potential to deliver greater value and insights.
Enhancing Strategic Advantage with Advanced Components

Although a basic CBM system will offer some solid benefits and insights, to get the maximum value out of a CBM system, more advanced components are needed. Below we discuss a few of the most important components, such as having churn models with multiple time horizons, adding price optimization, using simulation-based forecasting and adding competitor pricing data.
Multiple Horizon Churn Models
Sometimes it makes sense to look at churn from different perspectives, and one of those angles is the time horizon — or outcome period — you allow the model to have. For some business scenarios, it makes sense to have a model with a short outcome period, while for others it can make sense to have a model with a 1-year outcome period.
To better explain this concept, assume you build a churn model with 10-week outcome period. This model can then be used to give a prediction whether a given customer will churn within a 10-week period. However, assume now that you have isolated a specific event that you know causes churn and that you have a short window of perhaps 3 weeks to implement any preventative measure. In this case it makes sense to train a churn model with a 3-week horizon, conditional on the specific event you know causes churn. This way you can focus any retention activities on the customers most at risk of churning.
This kind of differentiated approach allows for a more strategic allocation of resources, focusing on high-impact interventions where they’re needed most. By adapting the model’s time horizon to specific situations, companies can optimize their retention efforts, ultimately improving customer lifetime value and reducing unnecessary churn.
Pricing Optimization & Customer Price Elasticity
Price is in many cases the final part of strategy execution, and the winners are the ones who can effectively translate a strategy into an effective price regime. This is exactly what a CBM system with prize optimization allow companies to do. While the topic of price optimization easily warrants its own article, we try to briefly summarize the key ideas below.
The first thing needed to get started is to get data on historic prices. Preferably different levels of price across time and other explanatory variables. This allows you to develop an estimate for price elasticity. Once that is in place, you can develop expected values for churn at various price points and use that to forecast expected values for revenue. Aggregating up from a customer level gives the expected value and expected churn on a product basis and you can find optimal prices per product. In more complex cases you can also have multiple cohorts per product that each have their optimal price points.
For example, assume a company has two different products, product A and product B. For product A, the company wishes to grow its user base and are only willing to accept a set amount of churn, while also being competitive in the market. However, for product B they are willing to accept a certain amount of churn in return for having an optimal price with respect to expected revenues. A CBM system allows for the roll out of such a strategy and gives the leadership a forecast for the future expected revenues of the strategy.
Simulation-Based Forecasting
Simulation based forecasting provides a more robust way generating forecast estimates rather than just doing point estimation based on expected values. By using methods like Monte Carlo simulation, we are able generate probability densities for outcomes, and thus provide decision makers with ranges for our predictions. This is more powerful than just point estimates because we are able to quantify the uncertainty.
To understand how simulation based forecasting can be used, we can illustrate with an example. Suppose we have 10 customers with given churn probabilities, and that each of these customers have a yearly expected revenue. (In reality we typically have a multivariate churn function that predicts churn for each of the customers.) For simplicity, assume that if the customer churns we end up with 0 revenue and if they don’t churn we keep all the revenue. We can use python to make this example concrete:
import random
# Set the seed for reproducibility
random.seed(42)

# Generate the lists again with the required changes
churn_rates = [round(random.uniform(0.4, 0.8), 2) for _ in range(10)]
yearly_revenue = [random.randint(1000, 4000) for _ in range(10)]

churn_rates, yearly_revenue
This gives us the following values for churn_rates and yearly_revenue:
churn_rates: [0.66, 0.41, 0.51, 0.49, 0.69, 0.67, 0.76, 0.43, 0.57, 0.41]
yearly_revenue: [1895, 1952, 3069, 3465, 1108, 3298, 1814, 3932, 3661, 3872]
Using the numbers above, and assuming the churn events are independent, we can easily calculate the average churn rate and also the total expected revenue.
# Calculate the total expected revenue using (1 - churn_rate) * yearly_revenue for each customer
adjusted_revenue = [(1 - churn_rate) * revenue for churn_rate, revenue in zip(churn_rates, yearly_revenue)]
total_adjusted_revenue = sum(adjusted_revenue)

# Recalculate the expected average churn rate based on the original data
average_churn_rate = sum(churn_rates) / len(churn_rates)

average_churn_rate, total_adjusted_revenue
With the following numbers for average_churn_rate and total_adjusted_revenue:
average_churn_rate:0.56,
total_adjusted_revenue: 13034.07
So, we can expect to have about 56% churn and a total revenue of 13034, but this doesn’t tell us anything about the variation we can expect to see. To get a deeper understanding of the range of possible outcomes we can expect, we turn to Monte Carlo simulation. Instead of taking the expected value of the churn rate and total revenue, we instead let the situation play out 10000 times (10000 is here chosen arbitrarily; the number should be chosen so as to achieve the desired granularity of the resulting distribution), and for each instance of the simulation customers either churn with probability churn_rate or they stay with probability 1- churn_rate.
import pandas as pd

simulations = pd.DataFrame({
    'churn_rate': churn_rates * 10000,
    'yearly_revenue': yearly_revenue * 10000
})

# Add a column with random numbers between 0 and 1
simulations['random_number'] = (
    [random.uniform(0, 1) for _ in range(len(simulations))])

# Add a column 'not_churned' and set it to 1, then update it to 0 based on the random number
simulations['not_churned'] = (
    simulations['random_number'] >= simulations['churn_rate']).astype(int)

# Add an 'iteration' column starting from 1 to 10000
simulations['iteration'] = (simulations.index // 10) + 1
This gives a table like the one below: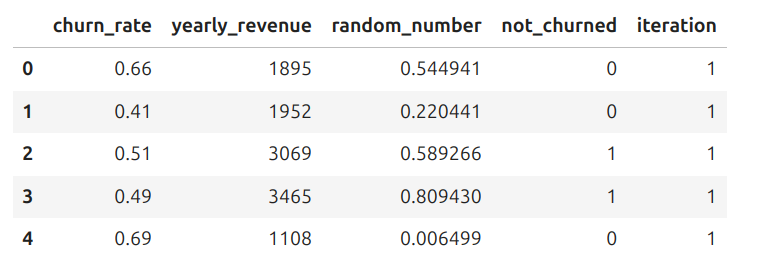
We can summarize our results using the following code:
# Group by 'iteration' and calculate the required values
summary = simulations.groupby('iteration').agg(
    total_revenue=('yearly_revenue',
       lambda x: sum(x * simulations.loc[x.index, 'not_churned'])),
    total_churners=('not_churned', lambda x: 10 - sum(x))
).reset_index()
And finally, plotting this with plotly yields: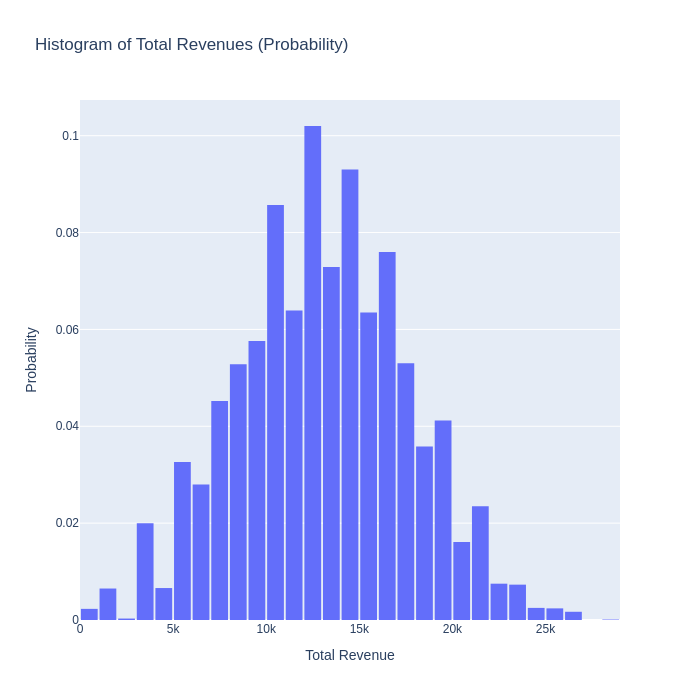
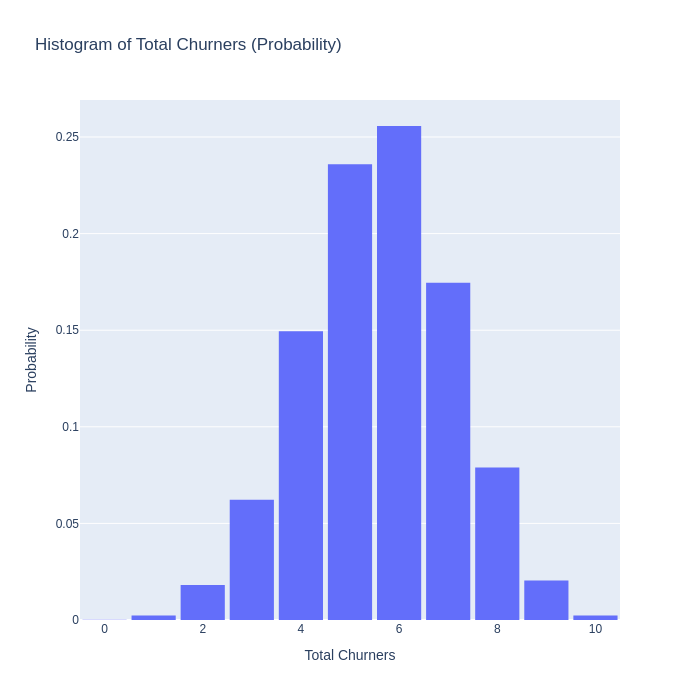
The graphs above tell a much richer story than the two point estimates of 0.56 and 13034 we started with. We now understand much more about the possible outcomes we can expect to see, and we can have an informed discussion about what levels of churn and revenue we we find acceptable.
Continuing with the example above we could for example say that we would only be prepared to accept a 0.1 % chance of 8 or more churn events. Using individual customer price elasticities and simulation based forecasting, we could tweak the expected churn_rates for customers so that we could exactly achieve this outcome. This kind of customer base control is only achievable with an advanced CBM system.
The Importance of Competitor Pricing
One of the most important factors in pricing is the competitor price. How aggressive competitors are will to a large degree determine how flexible a company can be in its own pricing. This is especially true for commoditized businesses such as utilities or telcos where it’s hard for providers to differentiate. However, despite the importance of competitor pricing, many business choose not to integrate this data into their own price optimization algorithms.
The reasons for not including competitor pricing in price algorithms are varied. Some companies claim that it’s too difficult and time consuming to collect the data, and even if they started now, they still wouldn’t have all the history they need to train all the price elasticity models. Others say the prices of competitor products are not directly comparable to their own and that collecting them would be difficult. Finally, most companies also claim that they have price managers who manually monitor the market and when competitors make moves, they can adjust their own prices in response, so they don’t need to have this data in their algorithms.
The first argument can increasingly be mitigated by good web scraping and other intelligence gathering methods. If that is not enough, there are also sometimes agencies that can provide historic market data on prices for various industries and sectors. Regarding the second argument about not having comparable products, one can also use machine learning techniques to tease out the actual cost of individual product components. Another method is also to use different user personas that can be used to estimate the total monthly costs of a specific set of products or product.
Ultimately, not including competitor prices leaves the pricing algorithms and optimization engines at a disadvantage. In industries where price calculators and comparison websites make it increasingly easy for customers to get a grasp of the market, companies run a risk of being out-competed on price by more advanced competitors.
Conclusion
In this article we have discussed the main components of a customer base management system as well as some of the advanced features that contribute to making these systems invaluable. Personally, having built a few of these systems, I think the combination of price optimization algorithms — running on a broad dataset of internal and external data — coupled with a powerful visual interface in the form a dashboard is one of the most effective tools for managing customers. This combination of tools allows managers and executive leadership really take control of the customer management process and understand the strategic consequence of their actions.
As Jeff Bezos — one of the most customer-obsessed leaders — put it:
“We can assure you that we’ll continue to obsess over customers. We have strong conviction that that approach — in the long term — is every bit as good for owners as it is for customers.” — Jeff Bezos, Amazon 2009 Letter to Shareholders
A commitment to customer management, underpinned by data and AI-driven insights, not only enhances customer satisfaction but also secures long-term value for stakeholders.
Thanks for reading!
Want to be notified whenever I publish a new article? ➡️ Subscribe to my newsletter here ⬅️. It’s free & you can unsubscribe at any time!
If you enjoyed reading this article and would like to access more content from me please feel free to connect with me on LinkedIn at https://www.linkedin.com/in/hans-christian-ekne-1760a259/ or visit my webpage at https://www.ekneconsulting.com/ to explore some of the services I offer. Don’t hesitate to reach out via email at hce@ekneconsulting.com
How to Build a Data-Driven Customer Management System was originally published in Towards Data Science on Medium, where people are continuing the conversation by highlighting and responding to this story.


